Timeline
Overview
note: * please consult the tree 'TimeLines' in the DEMOS project to see TimeLine plots in action
First, let's see some examples.
Tree:
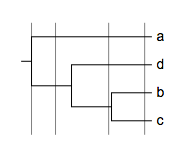
(a,(d,(b:0.2,c:0.3):0.4):0.3);
Example dataset:
!TimeLine	TotalTime=70,TimeUnit=Millions of Years

!TimeLineAxis
	Pos=Top,
        Ticks=20,10,5,
	TickLabelStyle=10,grey,0,0,
        Grid=0
... another example dataset ....
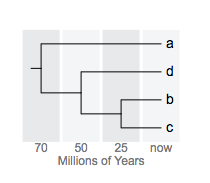
!TimeLine	TotalTime=70,TimeUnit=Millions of Years

!TimeLineStrips
	op=1,
	Strips=-11.67,11.67,35,58.33,81.67,
	StripColors=#F4F5F6,#E8E9EA,
	StripLabels=now,25,50,70,100,
	StripLabelStyle=12,#77787B,0,0,
	StripLabelPos=bottom,
        StripMarginPx=3
the '!TimeLine' modifier
The '!TimeLine' modifier is mandatory for all the following three types of timeline plots, the value of this modifier can be any combination of the following, separated by a ",": The following 'modifiers' (Key-Value pairs) are supported for heatmap:
| (case insensitive) | Alternative value | Mandatory | Description |
|---|---|---|---|
| totaltime=70 | any float number > 0 | Y | Total time from the root to the most distant leaf |
| TimeUnit=Millions of Years | any string | N | Time unit |
Note
please note:
-
TimeLine plot supports multi-line key-value pairs, i.e. the modifier and its value can be split into multiple line, as long as they are written in the correct format; see examples above. notes on preparing your datasets!!
-
please always use TAB to separate the modifiers and their values.
- if a modifier is used (accidentally) multiple tiles, only the last one will be used.
- the "data" part of this dataset can only contain two columns of tab-delimited texts; the third column, if presents, will be ignored
- please also always use TAB to separate the columns in the data section.
the '!timeLineAxis' modifier (Axis plot)
This modifier defines an axis and related parameters; the value of this modifier can be any combination of the following, separated by a ",":
| (case insensitive) | Alternative value | Mandatory | Description |
|---|---|---|---|
| pos=Top | Bottom | N | position (above or at the bottom of the tree) at which the axis will be plotted; default=top |
| Ticks=10,5,1 | any float numbers | Y | positions at which the 'major', 'minor' and 'other' ticks will be plotted; ticks=10 means a major tick will be plotted every 10 TimeUnit; ticks=10,5 means in addition to major ticks, a minor tick will be plotted every 5 TimeUnit; see examples below for details |
| TickLabels=A,B,C | any strings or numbers | N | customized labels for major ticks; by default, the tick labels are their corresponding values; see examples below |
| TickColors=red,blue,green | any valid HTML color names or hex colors | N | colors to be applied to ticks; if only one color is set (e.g. TickColors=red), the specified color will be applied to the major ticks; if two colors are set (e.g. TickColors=red,blue), they will be applied to the major and minor ticks respectively; see below for examples |
| TickLabelStyle=10,grey,1,0 | here '10'==font size, 'grey'==font color, '1'==font italic, '0'==font bold | N | styles of tick labels |
| Grid=0 | 1 | N | if ==1, plot grid lines at major and minor ticks; see examples below |
Examples
Example
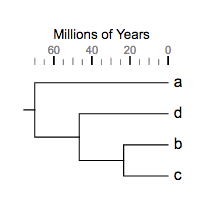
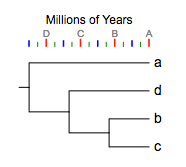
Example 1
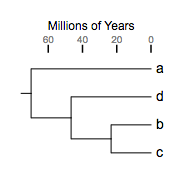
Axis on top:
!TimeLine	TotalTime=70,TimeUnit=Millions of Years

!TimeLineAxis
       # axis position
	Pos=Top,
    Ticks=20,10,5,
	TickLabelStyle=10,grey,0,0,
    Grid=0
Example
Example 2
Axis at bottom:
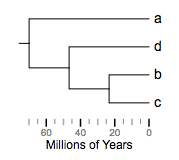
!TimeLine	TotalTime=70,TimeUnit=Millions of Years

!TimeLineAxis
       # axis position 'bottom'
	Pos=bottom,
    Ticks=20,10,5,
	TickLabelStyle=10,grey,0,0,
    Grid=0
Example
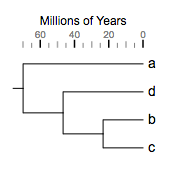
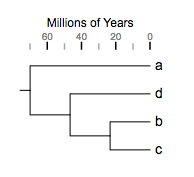
Example 3
major tick only:
!TimeLine	TotalTime=70,TimeUnit=Millions of Years

!TimeLineAxis
	Pos=top,
    # major tick only
    Ticks=20,
	TickLabelStyle=10,grey,0,0,
    Grid=0
Example
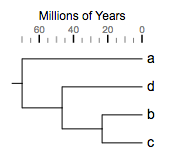
Example 4
major and minor ticks:
!TimeLine	TotalTime=70,TimeUnit=Millions of Years

!TimeLineAxis
	Pos=top,
    # major and minor ticks
    Ticks=20,10,
	TickLabelStyle=10,grey,0,0,
    Grid=0
Example
Example 5
major, minor and other ticks:
!TimeLine	TotalTime=70,TimeUnit=Millions of Years

!TimeLineAxis
	Pos=top,
    # major, minor and other ticks
    Ticks=20,10,5,
	TickLabelStyle=10,grey,0,0,
    Grid=0
Example
Example 6
customized tick label:
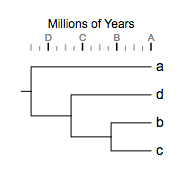
!TimeLine	TotalTime=70,TimeUnit=Millions of Years

!TimeLineAxis
	Pos=top,
    Ticks=20,10,5,
	TickLabelStyle=10,grey,0,0,
    # customized tick labels
    TickLabels=A,B,C,D,E,
    Grid=0
Example
Example 7
customized tick colors:
!TimeLine	TotalTime=70,TimeUnit=Millions of Years

!TimeLineAxis
	Pos=top,
    Ticks=20,10,5,
	TickLabelStyle=10,grey,0,0,
    TickLabels=A,B,C,D,E,
    # customized tick colors
    TickColors=red,blue,green,
    Grid=0
Example
Example 8
tick label styles:
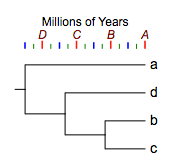
!TimeLine	TotalTime=70,TimeUnit=Millions of Years

!TimeLineAxis
	Pos=top,
    Ticks=20,10,5,
        ## tick label styles
	TickLabelStyle=12,darkred,1,0,
    TickLabels=A,B,C,D,E,
    TickColors=red,blue,green,
    Grid=0
Example
Example 9
Eshow grid lines:
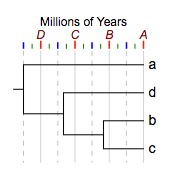
!TimeLine	TotalTime=70,TimeUnit=Millions of Years

!TimeLineAxis
	Pos=top,
    Ticks=20,10,5,
	TickLabelStyle=12,darkred,1,0,
    TickLabels=A,B,C,D,E,
    TickColors=red,blue,green,
    ## show grid line
    Grid=1
the '!timeLineLines' modifier (Line plot)
This modifier defines a set of time points at which lines will be plotted; this modifier can also be used to annotate these lines and control the visualisation styles of the lines. The value of this modifier can be any combination of the following, separated by a ",":
| (case insensitive) | Alternative value | Mandatory | Description |
|---|---|---|---|
| op=0.9 | any float number between 0~1 | N | opacity of the lines; default = 1 |
| lines=0,10,25,33,56 | any float numbers separated by ',' | Y | time points at which lines will be plotted; |
| LineWidths=1,2 | any float number or numbers | N | line widths; default = 1; if the number of widths is less than the number of lines, these widths will be cycled. |
| LineLabels=Label1,B,Label2 | any strings or numbers, separated by ',' | N | text labels for lines; see examples below |
| LineColors=red,blue,green | any valid HTML color names or hex colors | N | colors to be applied to lines; if the number of colors is less than the number of lines, these colors will be cycled; default == black |
| LineLabelStyles=10,grey,1,0 | here '10'==font size, 'grey'==font color, '1'==font italic, '0'==font bold | N | styles of line labels |
| LineLabelPos=Top | Bottom | N | position (above or at the bottom of the tree) at which the line labels will be plotted; default=top |
Examples
Example
Example 1
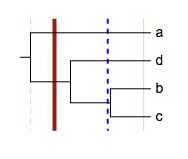
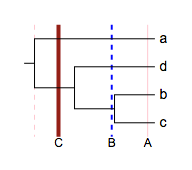
a timeline line plot will all available parameters:
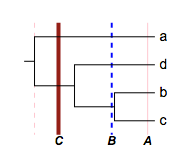
## note: in any timeline plot, the !TimeLine modifier is always mandatory --
!TimeLine	TotalTime=70,TimeUnit=Millions of Years

!TimeLineLines
	op=0.9,
	Lines=4,25,56,70,
	LineStyles=solid,dashed,
	lineWidths=1,2,4,
	lineColors=pink,blue,darkred,
	LineLabels=A,B,C,
	LineLabelStyle=12,black,1,1,
	lineLabelPos=bottom
Example
Example 2
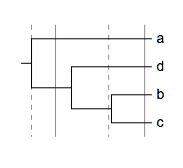
some simple lines:
!TimeLine	TotalTime=70,TimeUnit=Millions of Years

!TimeLineLines
	Lines=4,25,56,70
Example
Example 3
with line styles ('solid' and 'dashed'):
!TimeLine	TotalTime=70,TimeUnit=Millions of Years

!TimeLineLines
	op=0.9,
	Lines=4,25,56,70,
        # line styles
	LineStyles=solid,dashed
Example
Example 4
with line widths:
!TimeLine	TotalTime=70,TimeUnit=Millions of Years

!TimeLineLines
	op=0.9,
	Lines=4,25,56,70,
	LineStyles=solid,dashed,
	lineWidths=1,2,4
Example
Example 5
Eline colors:
!TimeLine	TotalTime=70,TimeUnit=Millions of Years

!TimeLineLines
	op=0.9,
	Lines=4,25,56,70,
	LineStyles=solid,dashed,
	lineWidths=1,2,4,
	lineColors=pink,blue,darkred
Example
Example 6
line labels:
!TimeLine	TotalTime=70,TimeUnit=Millions of Years

!TimeLineLines
	op=0.9,
	Lines=4,25,56,70,
	LineStyles=solid,dashed,
	lineWidths=1,2,4,
	lineColors=pink,blue,darkred,
	LineLabels=A,B,C
Example
Example 7
Eline label styles:
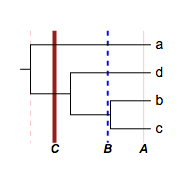
!TimeLine	TotalTime=70,TimeUnit=Millions of Years

!TimeLineLines
	op=0.9,
	Lines=4,25,56,70,
	LineStyles=solid,dashed,
	lineWidths=1,2,4,
	lineColors=pink,blue,darkred,
	LineLabels=A,B,C,
	LineLabelStyle=12,black,1,1
the !TimeLineStrips modifier (Strip plot)
This modifier defines a set of color strips to be plotted behind the trees; users will be allowed to annotate the strips and control their visualisation styles. The value of this modifier can be any combination of the following, separated by a ",":
| (case insensitive) | Alternative value | Mandatory | Description |
|---|---|---|---|
| op=0.9 | any float number between 0~1 | N | opacity of the strips (does not apply to the labels); default = 1 |
| strips=0,10,25,33,56 | any float numbers separated by ',' | Y | time points for strips; note: '0,10' defines a strip between 0~10; '0,10,25' defines two strips, 0~10 and 10~25; '0,10,25,33' defines three strips; |
| StripColors=red,blue,green | any valid HTML color names or hex colors, separated by ',' | N | fill-colors for the strips; if the number of colors is less than the number of strips, these colors will be cycled; default == black |
| StripLabels=Label1,B,Label2 | any strings or numbers, separated by ',' | N | text labels for strips; see examples below |
| StripLabelStyle=10,grey,1,0 | here '10'==font size, 'grey'==font color, '1'==font italic, '0'==font bold | N | styles of the text labels |
| StripLabelPos=Top | Bottom | N | position (above or at the bottom of the tree) at which the text labels will be plotted; default=top |
| StripMaginPx=3 | any float number | N | margin size for the strips in pixel |
| ShowTimeUnit=1 | 0 | N | show or hide time unit; see examples below |
Example
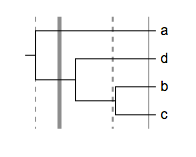
Example 1
a single strip:
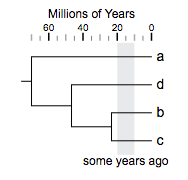
!TimeLine TotalTime=70,TimeUnit=Millions of Years
!TimeLineAxis
ticks=20,10,5,Pos=top
!TimeLineStrips
Strips=10,20,
StripColors=#E8E9EA,
StripLabels=some years ago,
StripLabelPos=bottom,
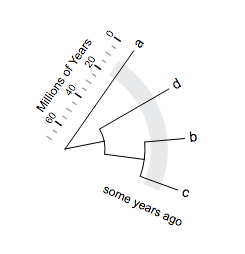
ShowTimeUnit=0
... in circular mode:
Example
Example 2
two strips (actually there are three strips, but the 2nd one is 'white'):
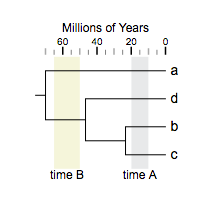
!TimeLine	TotalTime=70,TimeUnit=Millions of Years

!TimeLineAxis
	ticks=20,10,5,Pos=top

!TimeLineStrips
	Strips=10,20,50,65,
	StripColors=#E8E9EA,white,#F5F5DC,
	StripLabels=time A,,time B,
	StripLabelPos=bottom,
    ShowTimeUnit=0