Bootstrapvalue style
Overview
Bootstrap value style allows users to tweak the displaying style of bootstrap values.
Here is an example.
Tree:
(A:0.1,(B:0.2,(C:0.3,(D:0.4,E:0.5)40:0.6)80:0.05)100:0.1)90:0.43;
simple dataset
##bootstrap value styles
!bootstrapValueStyle	show=1,style=circle,size=10,place=1,color=red
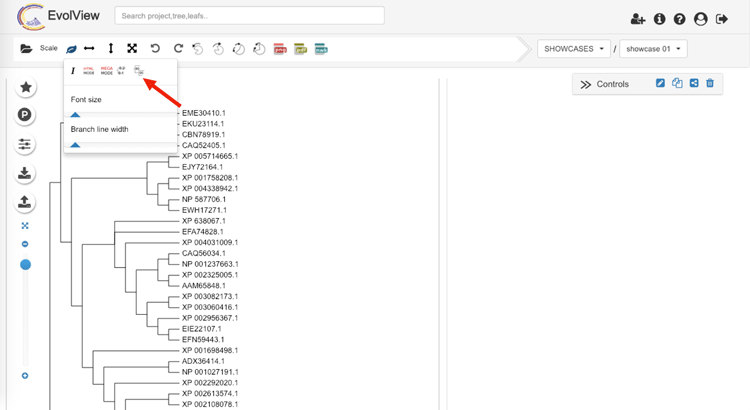
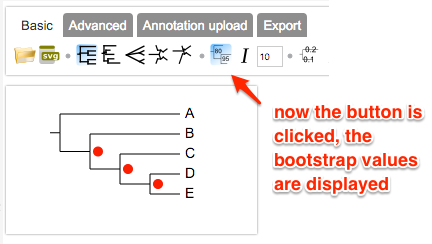
NOTE: in order to show bootstrap values, the tree has to have bootstrap values, and the "Show/Hide bootstrap scores" button on the toolbar has to be activated:
Supported modifiers
In addition to the universal modifiers , an additional 'modifier' is supported: !bootstrapValueStyles or !bootstrapValueStyle (case insensitive)
The value of this modifier can be any of the following options, individually or in combination:
| key | alternative value | description |
|---|---|---|
| show=1 | 0 | show or hide all bootstrap values; optional; default = 1 |
| style=numeric | any of the following:rect,circle,star,check,triangle | display bootstrap values as numbers or shapes; optional; default = numeric |
| size=10 | any integer >= 0 | set font size of the bootstrap values, or diameter of the shapes; optional, default = 10 |
| color=red or color=red:blue | any valid html color name, e.g. green, darkblue ..., or hex html color, e.g. #FF00FF | set fill and optional stroke color for the bootstrap values ; optional, default = black; see examples below for detail |
| strokewidth=1 | any integer >=1 | set strokewidth for bootstrap values, valid only when the strokecolor is set; optional, default = 1; see examples below for detail |
| place=1 | 2 or 3 or 4 | set the place where the bootstrap values to be displayed ; optional, default = 1; see examples below for detail |
Tip
notes on preparing your datasets!!
- please always use TAB to separate the modifiers and their values.
- if a modifier is used (accidentally) multiple tiles, only the last one will be used.
- the "data" part of this dataset can only contain two columns of tab-delimited texts; the third column, if presents, will be ignored
- please also always use TAB to separate the columns in the data section.
Data
Each line of data should consist of two parts, separated by a 'TAB' character. the first part defines the range of the bootstrap values; it could be either a single numeric value, or two values separated by a ',' or ':'. For example:
- 80
- 90,100
- 70:80
please note that the values are inclusive.
the second part sets the display styles for bootstrap values in the range defined in the first part. The 2nd part should be written similarly to the value of '!bootstrapValueStyles'.
For example:
- show=0,color=green,style=circle,size=20
- color=darkgreen
- style=rect,size=20
- are all valid.
NOTE:
- unlike other annotation datasets, the data part of 'Bootstrap Value Styles' is optional; when omitted, the global options defined by modifier '!bootstrapValueStyle' will be applied to all bootstrap values
- the data part, when available, will override the global options.
Example
Example 1
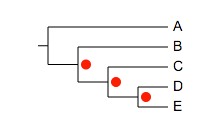
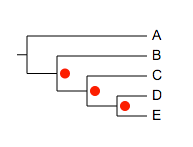
# bootstrap value style
## no data, global options will be applied to all bootstrap values
!bootstrapValueStyle	show=1,style=circle,size=10,place=1,color=red
Example
Example 2
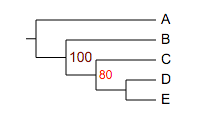
## hide bootstrap values less than 75, and apply colors according to bootstrap values
!bootstrapValueStyle	show=1,style=numeric,color=red
0,75	show=0
80,90	color=red,size=12
100,120	color=darkred,size=14
Example
Example 3
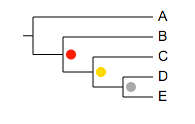
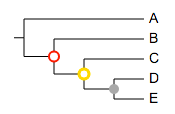
## plot bootstrap values as circles,
# and use different colors according to the corresponding values
!bootstrapValueStyle	show=1,style=circle
40	color=darkgrey
80	color=gold
100	color=red
Example
Example 4
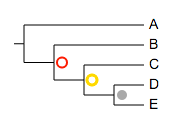
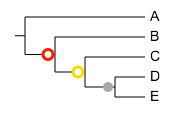
## use stroke color and stroke width
!bootstrapValueStyle	show=1,style=circle
40	color=darkgrey
80	color=white:gold,strokewidth=3
100	color=white:red,strokewidth=2
Example
Example 5
## place=2
!bootstrapValueStyle	show=1,style=circle,place=2
40	color=darkgrey
80	color=white:gold,strokewidth=3
100	color=white:red,strokewidth=2
Example
Example 6
## place=3
!bootstrapValueStyle	show=1,style=circle,place=3,strokewidth=3
40	color=darkgrey
60,80	color=white:gold
81,100	color=white:red
Example
Example 7
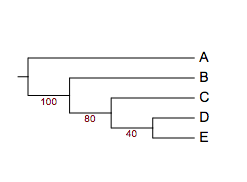
## place=4
!bootstrapValueStyle	show=1,style=numeric,place=4,color=darkred
Example
Example 8
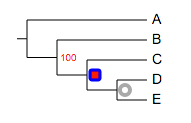
## a mixture of styles
!bootstrapValueStyle	show=1,style=circle,size=10,place=1,color=red,strokewidth=4
40	color=white:darkgrey
80	color=red:blue,style=rect,strokewidth=3
100	show=1,style=numeric
Example
Example 9
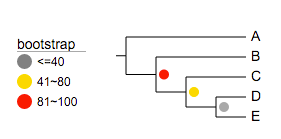
## with legend;
!Title	bootstrap
!Groups	<=40,41~80,81~100
!Colors	grey,gold,red
!LegendStyle	circle

!bootstrapValueStyle	show=1,style=circle
40	color=darkgrey
41,80	color=gold
81,100	color=red
Show multiple sets of bootstrap values
Evolview is starting to support multiple sets of bootstraps (meaning this functionality is still under-development). To do so users need to prepare the input tree in a very specific format, and a special "bootstrap style" dataset.
Here is an example:
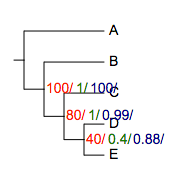
the input tree:
(A:0.1,(B:0.2,(C:0.3,(D:0.4,E:0.5)40/0.4/0.88:0.6)80/1/0.99:0.05)100/1/100:0.1)90/1/0.99:0.43;
note there are three sets of bootstrap values, they are written as '80/1/0.99'.
Dataset:
!bootstrapValueStyle show=1,style=multiple,size=10,color=red|green|blue
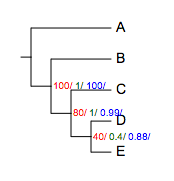
please note here:
- style=multiple
- 'color' has three color names, separated by '|'; if the number of colors is less than three (e.g. color=red|green), the colors will be cycled.
for example:
## there are three sets of bootstrap values, but only two colors:
!bootstrapValueStyle	show=1,style=multiple,size=10,color=red|green
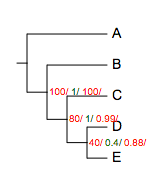
of course the font size can be changed:
!bootstrapValueStyle show=1,style=multiple,size=14,color=red|green|darkblue