Dotplot
Tree
(A:0.1,(B:0.2,(C:0.3,D:0.4)100:0.05)100:0.1)90:0.43;
Example dataset:
##dot plots
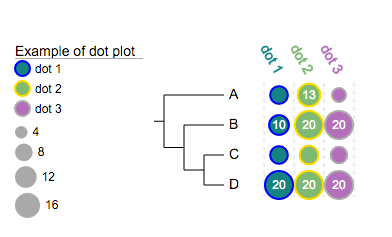
!groups dot 1,dot 2,dot 3
!colors #028482,#7ABA7A,yellow
!title Example of dot plot
# -- legends --
!legendstyle circle
!showLegends 1
## -- if !scalebycol is set to 1, each column of data will be scaled independently
!scalebycol 0
!byarea 1
# ---- grid and grid label / group label are also supported --
!grid 1
!gridlabel 1
# stroke and stroke color also work here
!defaultStrokeColor pink
#!defaultStrokeWidth 2
# here shape can be 'rect' or 'circle'; roundedcorner only applies to 'rect' shapes ...
!dotplots shape=circle,margin=2,colwidth=30,roundedcorner=3
## -- show data value works at here as well --
!showdataValue show=1,fontsize=12,fontcolor=black
A 8,13,5
B 10,20,20
C 8,9,7
D 20,20,20
Supported modifiers
The following 'modifiers' (Key-Value pairs) are supported for dot plots:
| Key (case insensitive) | Value | Description |
|---|---|---|
| universal modifiers | ||
| !Groups or !LegendText | comma separated text | Legend texts; for example 'group_a,group_b,group_c' |
| !LegendStyle or !Style | rect or circle or star | shapes to be plotted before the legend texts; default = rect |
| !LegendColors or !Colors | comma separated color codes or names | colors to be applied to the shapes specified by LegendStyle; for example 'red,green,yellow' ; note the number of colors should match the number of legend fields |
| !Title or !Legend | text | title of the legend; default = name of the dataset |
| !ShowLegends | 0 or 1 | 0 : hide legends; 1 : show legends |
| !opacity | float number between 0 to 1 | opacity of the dataset |
| modifiers shared with Bar Charts | modifiers that apply to both Bar Charts and Dot Plots | |
| !grid | none | show a background grid |
| !gridlabel or !axis | none | show grid labels (note: does not work in circular modes |
| !defaultStrokeWidth | any value >= 0 | stroke width that applies to both legends and the chart |
| !defaultStrokeColor | any valid color name such as red and yellow and html hex color such as #FF00FF | stroke color that applies to both legends and the chart; see more about stroke colors; also see the section below |
| dot plots specific | ||
| !scalebycol | none | scale the data by column, i.e. the max value in a column will take the maximum plot width of a column; default is to scale by the maximum of all data |
| other modifiers | ||
| !dotplots | see section below for more details | |
| !showdataValue | see section show data value for more details | |
| !columnLabelStyle | tweak column label styles; see 'column label style' below for detail |
Tip
notes on preparing your datasets!!
- please always use TAB to separate the modifiers and their values.
- if a modifier is used (accidentally) multiple tiles, only the last one will be used.
- the "data" part of this dataset can only contain two columns of tab-delimited texts; the third column, if presents, will be ignored
- please also always use TAB to separate the columns in the data section.
The !dotplots modifier
The 'value' of the modifier !dotplots can be any combination of the following, separated by a ",":
shape=circle,margin=2,colwidth=30,roundedcorner=3
| key | alternative value | description |
|---|---|---|
| shape = circle | rect | shape of the dot plots; default is circle |
| colwidth=30 | any integer > 0 | set pixel width per column ; optional; default = 20 |
| margin=2 | any integer >= 0 | set pixel space between columns; optional; default = 0 |
| roundedcorner=1 | any integer >= 0 | set rounded corner in pixels for rectangular; valid when shape=rect; optional, default = 0 |
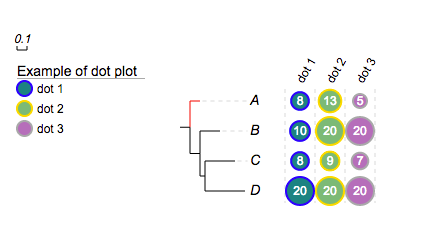
Strokes
User can choose different stroke colors for different columns using the modifier !colors; for example, by simply changing the value of !colors to :
#028482:blue,#7ABA7A:gold,#B76EB8:darkgrey
For example:
##dot plots
!groups	dot 1,dot 2,dot 3
## -- set stroke color --
!colors	#028482:blue,#7ABA7A:gold,#B76EB8:darkgrey
## -- set stroke width to 2 --
#!defaultStrokeColor	pink
!defaultStrokeWidth	2
!title	Example of dot plot
!legendstyle	circle
!showLegends	1
!byarea	1
!grid	1
!gridlabel	1
!dotplots	shape=circle,margin=2,colwidth=30,roundedcorner=3
!showdataValue	show=1,fontsize=12,fontcolor=white
A	8,13,5
B	10,20,20
C	8,9,7
D	20,20,20
Show data value
The 'value' of the modifier !showdataValue can be any combination of the following, separated by a ",":
| key | alternative value | description |
|---|---|---|
| show = 1 | 0 | show or hide data values; optional; the data values will be shown if omitted |
| fontsize=12 | any integer | set font size; optional; default = 10 |
| fontcolor=red | any value color name | set text color; optional; default = 'black' or 'white' depending on the background color |
| fontitalic=1 | 0 | set font italic; optional; default = 0 |
| valuesToHide=value1, or valuesToHide=value1:value2 | any number(s) | specify a single value to hide, e.g. valuesToHide=9, or a range of values to hide, e.g. valuesToHide=0.5:10 (inclusive). Default is to hide none |
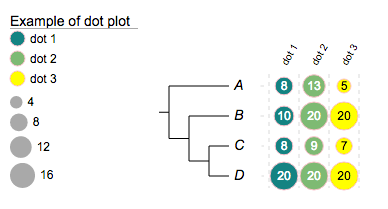
NOTE: when 'fontcolor' is omitted, the default font color will be either 'black' or 'white' depending the background color, for example:
!groups	dot 1,dot 2,dot 3
!colors	#028482,#7ABA7A,yellow
!title	Example of dot plot
!legendstyle	circle
!showLegends	1
!byarea	1
!grid	1
!gridlabel	1
!defaultStrokeColor	pink
!dotplots	shape=circle,margin=2,colwidth=30,roundedcorner=3
!showdataValue	show=1,fontsize=12,fontitalic=0,textalign=start
A	8,13,5
B	10,20,20
C	8,9,7
D	20,20,20
The purpose here is to ensure the readability of the texts on any background colors.
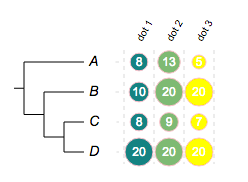
In this particular case, if we force the text color to 'white':
!groups	dot 1,dot 2,dot 3
!colors	#028482,#7ABA7A,yellow
!title	Example of dot plot
!legendstyle	circle
!showLegends	1
!byarea	1
!grid	1
!gridlabel	1
!defaultStrokeColor	pink
!dotplots	shape=circle,margin=2,colwidth=30,roundedcorner=3
!showdataValue	show=1,fontsize=12,fontcolor=white
A	8,13,5
B	10,20,20
C	8,9,7
D	20,20,20
... the texts of the 3rd column where the background color is yellow are unreadable:
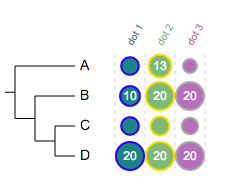
Hide a value or a range of values
Now we are going to hide values from 5 to 9 (inclusive):
!groups	dot 1,dot 2,dot 3
!colors	#028482,#7ABA7A,yellow
!title	Example of dot plot
!legendstyle	circle
!showLegends	1
!byarea	1
!grid	1
!gridlabel	1
!defaultStrokeColor	pink
!dotplots	shape=circle,margin=2,colwidth=30,roundedcorner=3
!showdataValue	show=1,fontsize=12,fontitalic=0,textalign=start,valuesToHide=5:9
A	8,13,5
B	10,20,20
C	8,9,7
D	20,20,20
Customise column label styles
NOTE: modifier !columnLabelStyle is also supported by heatmap. The 'value' of the modifier !columnLabelStyle can be any combination of the following, separated by a ","; for example:
show=1,fontsize=14,fontitalic=0,fontbold=1,textangle=60,fontcolor=red
| key | alternative valu | description |
|---|---|---|
| show = 1 | 0 | show or hide data values; optional; if omitted, the column lables will be shown |
| fontsize=12 | any integer | set font size; optional; default = 10 |
| fontcolor=red | any value color name | set text color for all labels; optional; default = colors matching the corresponding columns |
| fontitalic=1 | 0 | set font italic; optional; default = 0 |
| fontbold=1 | 0 | set font weight to bold; optional; default = 0 |
| textangle=-60 | any number(s) | set rotation angle; optional, default = -60 |
Example
Example 1
##dot plots
!groups	dot 1,dot 2,dot 3
## -- set stroke color --
!colors	#028482:blue,#7ABA7A:gold,#B76EB8:darkgrey
## -- set stroke width to 2 --
#!defaultStrokeColor	pink
!defaultStrokeWidth	2
!title	Example of dot plot
!legendstyle	circle
!showLegends	1
!byarea	1
!grid	1
!gridlabel	1
!dotplots	shape=circle,margin=2,colwidth=30,roundedcorner=3
!showdataValue	show=1,fontsize=12,fontcolor=white,valuestohide=5:9

!columLabelStyle	show=1,fontsize=14,fontbold=1,textangle=60

A	8,13,5
B	10,20,20
C	8,9,7
D	20,20,20