Column plot
Overview
Column plots provides a flexable way of visualising summary information of species in a phylogenetic tree, it was inspired by the figure 6 (the column plots on the right) of a recent publication in eLife:

source: Laumer, Christopher E., Andreas Hejnol, and Gonzalo Giribet. "Nuclear genomic signals of the ‘microturbellarian’roots of platyhelminth evolutionary innovation." eLife 4 (2015): e05503.
note: thanks to Desmond Ramirez of the UCSB who brought this figure to our attention.
Here is our implementation in evolview:
Tree:
(A:0.1,(B:0.2,(C:0.3,D:0.4)100:0.05)100:0.1)90:0.43;
Dataset:
## --
!columnplots	strokewidth=2,fontbold=1,fontsize=16,textangle=-45,spacebetweencolumns=15

## a column of data starts with a 'namedcolumn',
#it defines global options for the corresponding column
namedcolumn=thermopiles,color=purple:darker
	## followed by the following fragments
	from=A,to=C
	from=D,color=white:purple,text=?,width=20,style=circle,textangle=0

## -- 2nd column
namedcolumn=habitat,width=15
	from=A,to=B,text=aquatic,textangle=-90,color=white:lightblue
	from=C,to=D,text=?,textangle=0,color=white:darkgrey

## -- 3rd column
namedcolumn=fast evolving,color=lightgreen:darker
	from=A,style=star
	from=B,to=D
	from=C,style=none,text=*,textangle=0,width=20
Supported modifiers
Due to the complexity of the plot, we adopted here a new approach for the dataset, thus many so-called universal modifiers are no longer supported except those that are related to the legend. Below are universal modifiers that are still supported by Column plots:
| Key (case insensitive) | Value | Description |
|---|---|---|
| !Groups or !LegendText | comma separated text | Legend texts; for example 'group_a,group_b,group_c' |
| !LegendStyle or !Style | rect or circle or star | shapes to be plotted before the legend texts; default = rect |
| !LegendColors or !Colors | comma separated color codes or names | colors to be applied to the shapes specified by LegendStyle; for example 'red,green,yellow' ;note the number of colors should match the number of legend fields |
| !Title or !Legend | text | title of the legend; default = name of the dataset |
| !ShowLegends | 0 or 1 | 0 : hide legends; 1 : show legends |
| !opacity | float number between 0 to 1 | opacity of the dataset |
the !columnPlots modifier
here we introduce a new modifier !columnPlots to allow users to control the following aspect of the plot globally: * fill and text color * default stroke color * default stroke width * font size, italic, bold and rotation angle * column width and space between columns
please note all these global options can be overriden by local settings.
A typical !columnPlots would look like the following (NOTE: this is written in one line, not multiple lines):
!columnPlots width=10,spaceBetweenColumns=10,color=green:red,strokewidth=1,textangle=-60,style=rect,roundedcorner=5,fontsize=14
please remember always use a 'TAB' character to separate !columnPlots from its value.
The value of !columnPlots is mandatory; it can be any of the following options, individually or in combination:
| key | alternative value | description |
|---|---|---|
| width=10 | any integer >= 0 | set column width, default = 10 |
| spaceBetweenColumns=10 | any integer >= 0 | set space between columns, default = 10 |
| style=rect | any of the following:none,rect,circle,star,check,triangle | style / shape to be plotted, default = rect |
| fontsize=10 | any integer >= 0 | set font size for columns labels, default = 14 |
| fontitalic=0 | 1 | set font italic for columns labels, default = 0 |
| fontbold=0 | 1 | set font bold for columns labels, default = 0 |
| color=red, or color=red:blue | any valid html color name, e.g. green, darkblue ..., or hex html color, e.g. #FF00FF | set fill and optional stroke color; fill color will be also applied to column labels, default = black; see examples below for detail |
| strokewidth=1 | any integer >=1 | set strokewidth, valid only when the strokecolor is set, default = 1; see examples below for detail |
Please note that Evolview supports the use of "darker", "brighter" and "lighter" as stroke colors. For example, the following usages are all valid:
- red:darker
- '#FF00FF':lighter
- darkblue:brighter
When 'darker' or 'brighter'/'lighter' is used, the stroke color will be 20% darker or brighter than the specified color.
See here for more details.
prepare a column of data for visualisation
As shown in the previous example, a column of data often consists of two parts,
-
a line of text starts with a mandatory filed 'namedcolumn=name of the column', followed by any numbers of the options mentioned in the table above, for example:
- namedcolumn=thermopiles,color=purple:darker
- namedcolumn=habitat,width=15 the options following 'namedColumn' control the displaying styles of current column, and overrides the corresponding global options.
-
several lines of text, each line defines a fragment / segment to be plotted. For example:
-
from=A,to=C
- from=D,color=white:purple,text=?,width=20,style=circle,textangle=0 the 'fragment' line should contain the following elements:
- the starting point, i.e. the name of the leaf node, of the fragment using 'from='; mandatory
- an optional ending point / the name of a leaf node using 'to='
- any numbers of the options mentioned in the above table; optional. These options control the displaying styles of current fragment, and overrides the corresponding global options
Here is an example:
## a column of data starts with a 'namedcolumn',
##it defines global options for the corresponding column
namedcolumn=thermopiles,color=purple:darker
	## followed by the following fragments
	from=A,to=C
	from=D,color=white:purple,text=?,width=20,style=circle,textangle=0
Tip
Note:
- the dataset is case-insensitive
- the indentation at the begining of the framents is optional
Example
Example 1
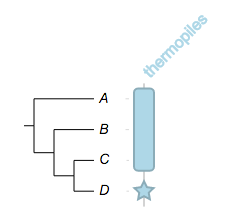
Example 1. a column with two fragments, one span three leaf nodes, while the other spans only one.:
## --
## -- some global options
!columnplots	strokewidth=2,fontbold=1,fontsize=16,textangle=-45

## -- a column with two fragments, note how the stroke color is defined
namedcolumn=thermopiles,color=lightblue:darker
	## note: the indentation is optional
	from=A,to=C
	from=D
Example
Example 2
try change the style / shape of the fragments, however it only work when a fragment spans only one leaf node:
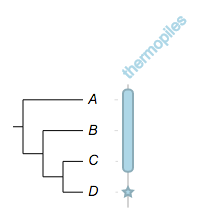
##
## -- some global options
!columnplots	strokewidth=2,fontbold=1,fontsize=16,textangle=-45

## -- a column with two fragments, note how the stroke color is defined
namedcolumn=thermopiles,color=lightblue:darker
	## try change the style / shape, but it wouldn't work here
	from=A,to=C,style=star
    ## but, it will work here
	from=D,style=star
Example
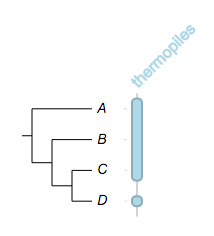
Example 3
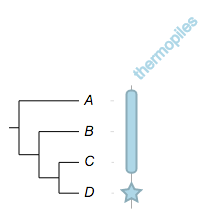
now try change the width of the fragments:
##
## -- some global options
!columnplots	strokewidth=2,fontbold=1,fontsize=16,textangle=-45

## -- set width to 20, it will apply to both fragments
namedcolumn=thermopiles,color=lightblue:darker,width=20
	from=A,to=C,style=star
	from=D,style=star
Example
Example 4
you can change the widths of the fragments individually:
##
## -- some global options
!columnplots	strokewidth=2,fontbold=1,fontsize=16,textangle=-45

## please note, width=25 here specifies the overall plot width of current column,
##    it is thus meaningful even it is overridden later.
namedcolumn=thermopiles,color=lightblue:darker,width=25
	from=A,to=C,width=10
	from=D,style=star,width=20
Example
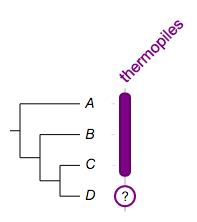
Example 5
we know for sure the first three species are thermophilic, but the last one???
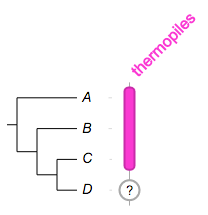
##
## -- some global options
!columnplots	strokewidth=2,fontbold=1,fontsize=16,textangle=-45

namedcolumn=thermopiles,color=#FF33CC:darker,width=25
	from=A,to=C,width=10
	from=D,style=circle,color=white:darkgrey,width=20,text=?,textangle=0
Example
Example 6
now we'd like the readers to pay more attention to species A and C:
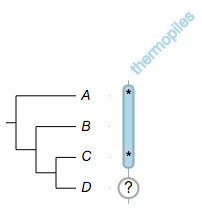
##
## -- some global options
!columnplots	strokewidth=2,fontbold=1,fontsize=16,textangle=-45

namedcolumn=thermopiles,color=lightblue:darker,width=25
	from=A,to=C,width=10

	## -- don't forget to set style=none
	from=A,style=none,text=*,fontsize=16,textangle=0
	from=C,style=none,text=*,fontsize=16,textangle=0

	from=D,style=circle,color=white:darkgrey,width=20,text=?,textangle=0
Example
Example 7
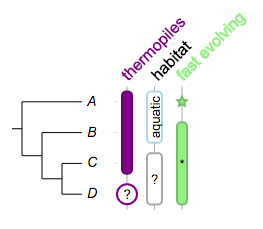
we can have multiple columns in a dataset:
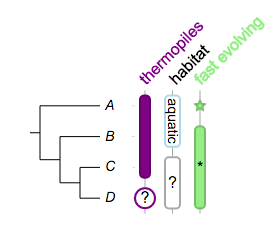
##
!columnplots	strokewidth=2,fontbold=1,fontsize=16,textangle=-45,spacebetweencolumns=15

## a column of data starts with a 'namedcolumn',
## it defines global options for the corresponding column
namedcolumn=thermopiles,color=purple:darker
	## followed by the following fragments
	from=A,to=C
	from=D,color=white:purple,text=?,width=20,style=circle,textangle=0

## -- 2nd column
namedcolumn=habitat,width=15
	from=A,to=B,text=aquatic,textangle=90,color=white:lightblue,fontsize=14
	from=C,to=D,text=?,textangle=0,color=white:darkgrey

## -- 3rd column
namedcolumn=fast evolving,color=lightgreen:darker
	from=A,style=star
	from=B,to=D
	from=C,style=none,text=*,textangle=0,width=20
Tip
Please NOTE:
- the plot is optimized for cladogram and phylogram, thus it wouldn't be as pretty in circular mode
- please send us (evolgenius.team@gmail.com) email if you have encountered any problems using EvolView, attach your tree and datasets if necessary
- please also send us your suggestions and feature requests!
Add column plots to collapsed trees
Evolview supports collapsing at internal nodes; collapsed nodes are treated as leaf nodes. It is therefore very straightforward to add column plots to a collapsed tree. See here for more information.