Gene Synteny
Overview
Evolview supports visualization of gene synteny.The annotation has the following mandatory properties:
- !groups Provide the genes represented in the plot.
- !Colors Provide the colors in which genes are represented.
- !genesynteny gene display properties and visualization style provided by the user
- !totgenes Total genes used for the plot.(should be same as total number of groups)
Here is an quick example
Related modifiers
Supported Key-Value pairs
| Key (case insensitive) | Value | Description |
|---|---|---|
| width=20 | default value is 20 | the width of gene is decided by user input or uses default pre-set value |
| height=10 | default value is 10 | the height of gene is decided by user input or uses default pre-set value |
| style=1 | default value is 1 | Default style is set to be 1,for other visualization users can choose other styles. |
| fillbg=1 | value can b 1 or 0 | the gene blocks can have filled background color or transparent. |
| strokecolor=blue | the stroke color for the genes. | the default color is same as the color of the gene background. |
| stroketype=line | default value is the line | Default style is set to be line,for other visualization users can choose dashlines. |
| fontcolor=black | any color name or valid html hex colors such as #FF0000 | default color of group labels; default = black; if omitted, uses 'color' |
| fontsize=12 | any integer | set font size; optional; default = 10 |
| fontitalic=1 | 0 | set font italic; optional; default = 0 |
| bkcolor=colorname | any color name or valid html hex colors such as #FFFF00 | default color for group background; default = lightblue |
Data
Each line of the Data section usually consists two parts, separated by a TAB. The first part defines to where the group label will be placed, it can be either:
- names of two leaf labels, separated by a ',', or
- a name of a leaf label.
- The second part specifics the 'label' (required) and second part provides the gene information(gane_name:direction).
- The directions can 0: unknown direction,1:left arrow,2:right arrow
See below:
Visualization styles
Tree
(A:0.1,(B:0.2,(C:0.3,D:0.4)100:0.05)100:0.1)90:0.43;
Style-1
Style-1
copy & paste the following contents to Evolview to view the visualisation results:
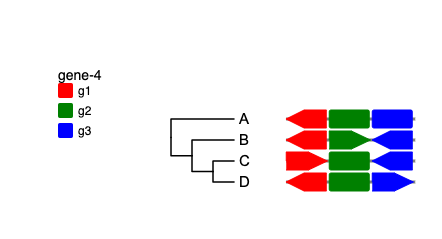
Example-1
Example 1
!groups g1,g2,g3
!Colors red,green,blue
!genesynteny style=1,fontcolor=black,fontsize=8
!totgenes 3
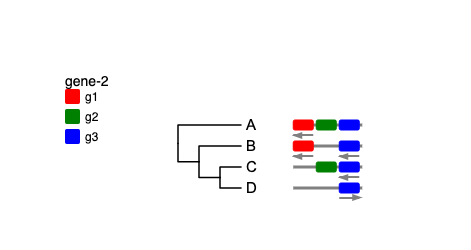
!showGeneLabel 0
!showGeneDirection 1
A g1:1,g2:0,g3:0
B g1:1,g3:1
C g2:0,g3:1
D g3:2
Example-2
Example 2
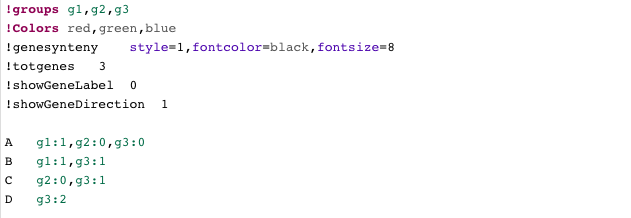
with !showGeneLabel 1 prints the gene labels and absence of !showGeneDirection hides the direction information of the genes.
!groups	g1,g2,g3
!Colors	red,green,blue
!genesynteny	style=1,fontcolor=black,fontsize=15,width=40,height=20
!totgenes	3
!showGeneLabel	1

A	g1:1,g2:0,g3:0
B	g1:1,g2:2,g3:1
C	g1:2,g2:0,g3:1
D	g1:1,g2:0,g3:2
Style-2
Style-2
The style info is set using the style keyword in the gene synteny properties.
Example-1
Example 1
!groups g1,g2,g3
!Colors red,green,blue
!genesynteny style=1,fontcolor=black,fontsize=8
!totgenes 3
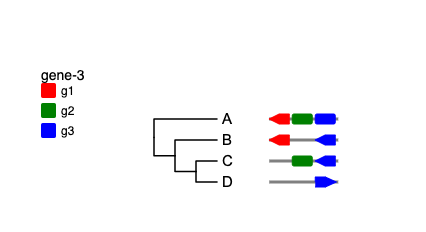
!showGeneLabel 0
!showGeneDirection 1
A g1:1,g2:0,g3:0
B g1:1,g3:1
C g2:0,g3:1
D g3:2
Example-2
Example 2
!groups g1,g2,g3
!Colors red,green,blue
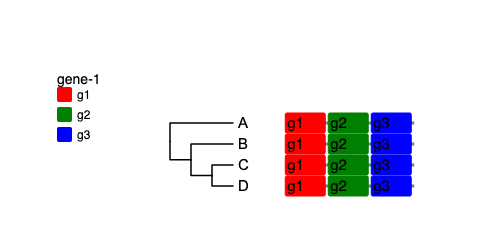
!genesynteny style=2,fontcolor=black,fontsize=8,width=40,height=18
!totgenes 3
!showGeneLabel 0
!showGeneDirection 1
A g1:1,g2:0,g3:0
B g1:1,g2:2,g3:1
C g1:2,g2:0,g3:1
D g1:1,g2:0,g3:2