Bar chart
Tip
notes on preparing your dataset!!
- please always use TAB to separate the modifiers and their values.
- some modifiers should not be used in combination, e.g. !itemHeightPX and !itemHeightPCT.
- However if both are used (accidentally), only !itemHeightPX be used.
- if a modifier is used (accidentally) multiple tiles, only the last one will be used.
- the "data" part of this dataset can only contain two columns of tab-delimited texts; the third column, if presents, will be ignored
- please also always use TAB to separate the columns in the data section.
Related modifiers
(specific to bar plots)
| Key (case insensitive) | Value | Description |
|---|---|---|
| !align or !alignIndividualColumn | none | align individual columns if the bars are stacked |
| !Fanplot or ! Fan | none | works only with circular tree; see examples bellow |
| new: !showdataValue | show data values; see here for more details | |
| new: !RowDataReorder | no, asc, desc | reorder the display order of stacked bars according to their corresponding values. default no; asc: in ascending order; desc: in descending order; see here for more details |
Other usefull modifiers
| Key (case insensitive) | Value | Description |
|---|---|---|
| !PlotWidth | integer > 0 | pixel width of the dataset on canvas |
| !itemHeightPX or !barHeightPX | integer > 0 | pixel height of each bar; see examples bellow |
| !itemHeightPCT or !barHeightPCT | float number between 1 to 100 | percentage of available height taken by each bar; see examples bellow |
| !grid | none | show a background grid |
| !gridlabel or !axis | none | show the values corresponding to the grid lines |
Tree
(A:0.1,(B:0.2,(C:0.3,D:0.4)100:0.05)100:0.1)90:0.43;
Example
Example 1
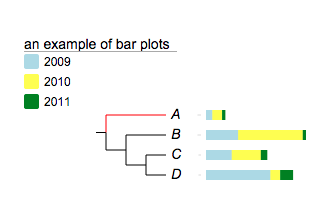
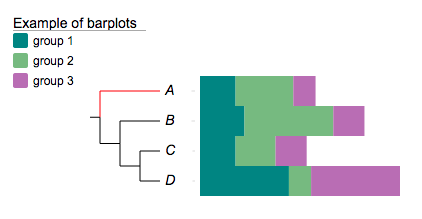
##barplots
!groups	2009,2010,2011
!colors	lightblue,yellow,green
!showLegends	1
!plotwidth	100
!style	rect
!title	an example of bar plots
A	2,3,1
B	10,20,1
C	8,9,2
D	20,3,4
Example
Example 2
To have the grid for bar plots:
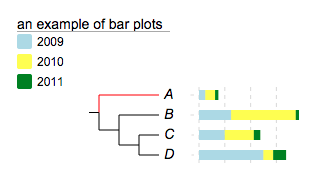
##barplots
## to turn grid on
!grid
!groups	2009,2010,2011
!colors	lightblue,yellow,green
!showLegends	1
!plotwidth	100
!style	rect
!title	an example of bar plots
A	2,3,1
B	10,20,1
C	8,9,2
D	20,3,4
Example
Example 3
To align the bar plots:
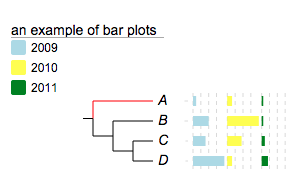
##barplots
## to turn grid on
!grid
!align
!groups	2009,2010,2011
!colors	lightblue,yellow,green
!showLegends	1
!plotwidth	100
!style	rect
!title	an example of bar plots
A	2,3,1
B	10,20,1
C	8,9,2
D	20,3,4
Example
Example 4
To activate fan plot of the bars in circular mode:
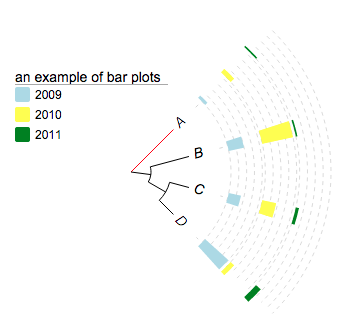
##barplots
## to turn grid on
!grid
!align
!Fanplot
!groups	2009,2010,2011
!colors	lightblue,yellow,green
!showLegends	1
!plotwidth	100
!style	rect
!title	an example of bar plots
A	2,3,1
B	10,20,1
C	8,9,2
D	20,3,4
Height modfiers
heights of individual bars
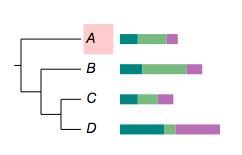
By default, the height of an individual bar is 10 pixel, it can be changed using two modifiers:
- !itemHeightPX
- !itemHeightPCT !itemHeightPX specifies the absolute pixel height for individual bars; its value ranges from >0 to 40. Here are some examples:
Example
Example 1
!groups	group 1,group 2,group 3
!colors	#028482,#7ABA7A,#B76EB8
## -- set height for individual bars --
## -- default value is 10 --
!itemHeightPX	10
A	8,13,5
B	10,20,7
C	8,9,7
D	20,5,20D 20,5,20
Example
Example 2
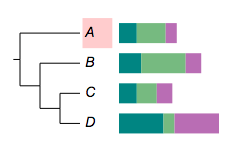
!groups	group 1,group 2,group 3
!colors	#028482,#7ABA7A,#B76EB8
## -- if the pixel height is larger than the available space,
## -- which is 30 pixel in this case,
## -- only available space will be taken by the bars (30 pixel)
!itemHeightPX	35
A	8,13,5
B	10,20,7
C	8,9,7
D	20,5,20
Example
Example 3
!groups	group 1,group 2,group 3
!colors	#028482,#7ABA7A,#B76EB8
## -- now we dont mention any height --
A	8,13,5
B	10,20,7
C	8,9,7
D	20,5,20
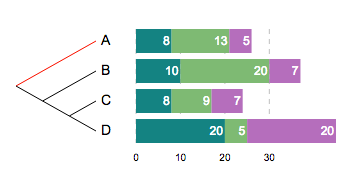
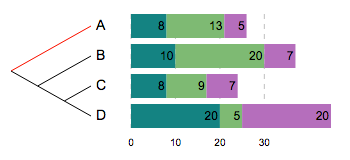
Show data values
Now users can use modifier '!showdataValue' to enable the display the bar values.
Example
Example 1
!groups	group 1,group 2,group 3
!colors	#028482,#7ABA7A,#B76EB8
!title	Example of barplots 4
!plotwidth	200
!itemHeightPCT	80
!grid
!axis
!showLegends	0

## -- here you go the new modifier --
## -- please use 'TAB' to separate this modifier with its value --
!showdataValue	show=1,fontsize=12,fontitalic=1,textalign=end

A	8,13,5
B	10,20,7
C	8,9,7
D	20,5,20
The 'value' part of the modifier !showdataValue can be any combination of the following, separated by a ",":
| key-value | alternative value | description |
|---|---|---|
| show = 1 | 0 | show or hide data values; optional; the data values will be shown if omitted |
| fontsize=12 | any integer | set font size; optional; default = 10 |
| fontcolor=red | any value color name | set text color; optional; default = black |
| fontitalic=1 | 0 | set font italic; optional; default = 0 |
| textalign=middle | start or end | set text align; optional; default = middle; see the following examples |
Example
Example 2
!groups	group 1,group 2,group 3
!colors	#028482,#7ABA7A,#B76EB8
!title	Example of barplots 4
!plotwidth	200
!itemHeightPCT	80
!grid
!axis
!showLegends	0

!showdataValue	show=1,fontsize=12,fontitalic=1,textalign=end,fontcolor=white
A	8,13,5
B	10,20,7
C	8,9,7
D	20,5,20
Example
Example 3
align the values to the end of the bars:
!groups	group 1,group 2,group 3
!colors	#028482,#7ABA7A,#B76EB8
!title	Example of barplots 4
!plotwidth	200
!itemHeightPCT	80
!grid
!axis
!showLegends	0

!showdataValue	show=1,fontsize=12,fontitalic=1,textalign=end,fontcolor=white
A	8,13,5
B	10,20,7
C	8,9,7
D	20,5,20
Example
Example 4
align the values to the start of the bars:
!groups	group 1,group 2,group 3
!colors	#028482,#7ABA7A,#B76EB8
!title	Example of barplots 4
!plotwidth	200
!itemHeightPCT	80
!grid
!axis
!showLegends	0
!showdataValue	show=1,fontsize=12,fontitalic=1,textalign=start,fontcolor=white
A	8,13,5
B	10,20,7
C	8,9,7
D	20,5,20
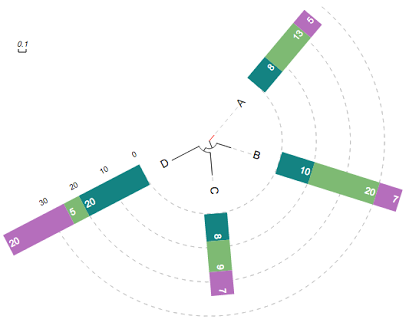
Change display order of stacked bars
Users now can use modifier '!RowDataReorder' to change the display order of the stacked bars according to their corresponding values in either ascending or descending orders.
Example
Example 1
barplot with row data re-ordered in ascending order.
!groups	group 1,group 2,group 3
!colors	#028482,#7ABA7A,#B76EB8
!title	barplot with data shown
!fan
!itemHeightPCT	80
!plotWidth	150

## -- new modifier here!!!
!RowDataReorder	asc

### last modified: sep 28, 2014
!showData
!showDataFontSize	10
!showDataFontColor	white
!showDataTextAlign	start

A	8,13,5
B	10,20,7
C	8,9,7
D	20,5,20
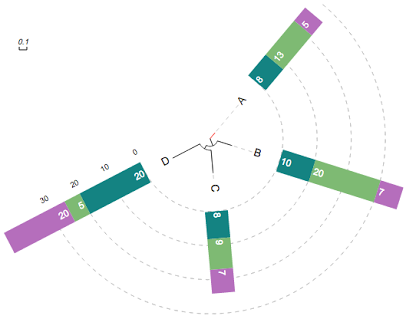
Example
Example 2
barplot with row data re-ordered in descending order.
!groups	group 1,group 2,group 3
!colors	#028482,#7ABA7A,#B76EB8
!title	barplot with data shown
!fan
!itemHeightPCT	80
!plotWidth	150

## -- new modifier here!!!
!RowDataReorder	desc

### last modified: sep 28, 2014
!showData
!showDataFontSize	10
!showDataFontColor	white
!showDataTextAlign	start

A	8,13,5
B	10,20,7
C	8,9,7
D	20,5,20